MVRV Ratio Calculator
What is MVRV?
The MVRV Ratio (Market Value to Realized Value) compares current market price to the average cost basis of all coins. When it drops below 1, it often signals undervaluation. Used in 68% of institutional reports as of mid-2023.
MVRV = Current Market Price / Realized Price
Result
Enter values to see analysis
When you look at a Bitcoin transaction, you’re not just seeing numbers move from one address to another. You’re looking at a permanent, public record of economic activity-untampered, timestamped, and traceable. This is the core of on-chain data mining: pulling raw transaction details from blockchains to understand what’s really happening in the crypto world. Unlike stock markets where you rely on filings and reports, crypto gives you direct access to every trade, transfer, and smart contract call ever made. But mining this data isn’t just about reading addresses. It’s about decoding behavior, spotting patterns, and separating noise from real signals.
What Exactly Is On-Chain Data?
On-chain data is everything recorded directly on a blockchain’s public ledger. For Bitcoin, that includes sender and receiver addresses, transaction amounts, miner fees, block timestamps, and the unique hash of each transaction. Ethereum adds smart contract interactions, gas usage, and token transfers. This isn’t guesswork-it’s factual history. Once a transaction is confirmed, it can’t be changed. That’s why institutions trust it more than exchange volume reports, which can be manipulated or inflated.Think of it like a public bank statement that never disappears. Every time someone sends ETH, stakes tokens, or swaps on Uniswap, it’s permanently written into the chain. Platforms like Etherscan and Blockchain.com let you view this data for free. But raw data alone doesn’t tell you much. The real value comes from turning it into metrics you can act on.
Key Metrics That Matter
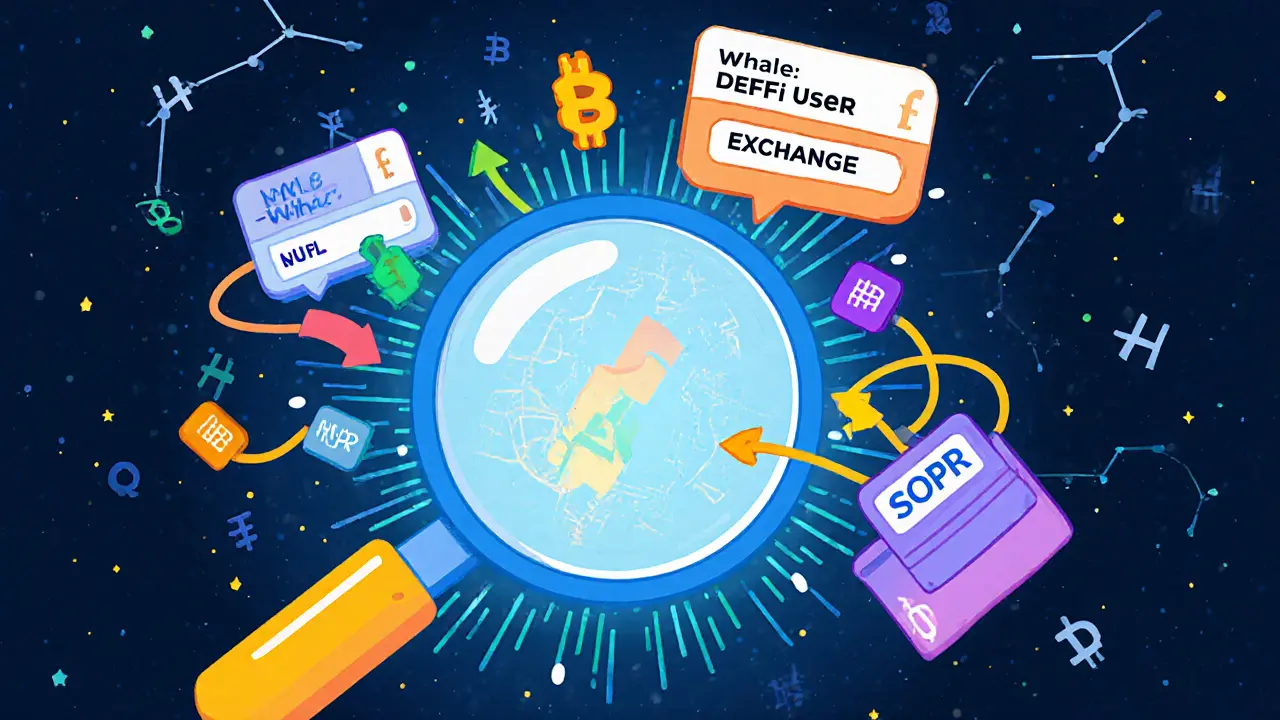
Not all on-chain data is equally useful. Here are the metrics professionals actually use:- MVRV Ratio (Market Value to Realized Value): Compares current market price to the average cost basis of all coins. When it drops below 1, it often signals undervaluation. Used in 68% of institutional reports as of mid-2023.
- NUPL (Net Unrealized Profit/Loss): Shows how much profit or loss holders have on paper. A negative NUPL often precedes market bottoms.
- SOPR (Spent Output Profit Ratio): Measures whether people are selling at a profit or loss. Values above 1 mean profit-taking; below 1 means panic selling.
- Whale Movements: Transactions over $100,000. A University of Cambridge study found these predict short-term price moves with 92% accuracy.
- Active Addresses: Daily unique wallets sending or receiving crypto. Rising numbers suggest growing adoption.
These aren’t just indicators-they’re signals backed by real behavior. For example, in early 2023, a spike in NUPL above 0.7 signaled that most Bitcoin holders were sitting on profits. Weeks later, the price dropped 30%. That wasn’t luck. That was data telling a story.
How Different Blockchains Change the Game
Not all blockchains are built the same. Bitcoin uses a UTXO model-each transaction input is a separate output that gets spent. Ethereum uses an account-based model, where each address has a balance like a bank account. This affects how you analyze data.Bitcoin’s blockchain is over 500GB as of late 2023. That means running a full node requires serious storage and bandwidth. Ethereum, with its smart contracts, generates far more complex data. Each DeFi interaction, NFT sale, or staking deposit leaves a trace. But Ethereum’s transaction speed is slow-only 15-30 per second-and gas fees can swing from $0.50 to $50 depending on congestion.
Solana, on the other hand, handles 2,000-4,000 transactions per second with near-zero fees. That means more data, faster. But more data doesn’t always mean better insight. High volume can mask real activity. In Q1 2023, 43% of Ethereum’s “activity” came from arbitrage bots, not humans. If you don’t filter that out, you’ll think adoption is growing when it’s just machines trading.
Tools of the Trade: Free vs. Paid
You don’t need to pay a fortune to start. Free tools like Etherscan, Blockchain.com, and Blockchair let you explore transactions, track token flows, and see wallet balances. But they’re like looking at a map without labels.Premium platforms like Glassnode and Nansen turn raw data into actionable intelligence. Glassnode’s Realized HODL Waves show how long coins have been held-useful for spotting long-term holders versus speculators. Nansen labels wallets: “Exchange,” “DeFi User,” “Whale,” “Smart Money.” That’s huge. If you see a wallet labeled “Smart Money” buying a new token, you’re not just seeing a transaction-you’re seeing what an experienced player is doing.
But pricing is steep. Glassnode’s basic plan starts at $99/month. Nansen’s retail plan is $99/month. Enterprise access to Ethereum’s full dataset on Google BigQuery costs $500/month. For retail traders, that’s a barrier. Many users on Reddit and CryptoSlate complain that $499/month plans are unrealistic unless you’re managing a fund.
Where On-Chain Analysis Works-and Where It Fails
On-chain data shines in three areas:- Tracking large wallets: When a whale moves $50M in ETH, it’s visible. Exchanges can’t hide that.
- Measuring network health: Rising active addresses, stable miner fees, and low exchange outflows suggest confidence.
- Spotting fraud: If a token’s supply suddenly spikes with no public announcement, it’s likely a rug pull.
But it fails in three big ways:
- Privacy coins: Monero, Zcash, and others obscure transaction details. Only 1.7% of Monero’s data is analyzable, according to Chainalysis.
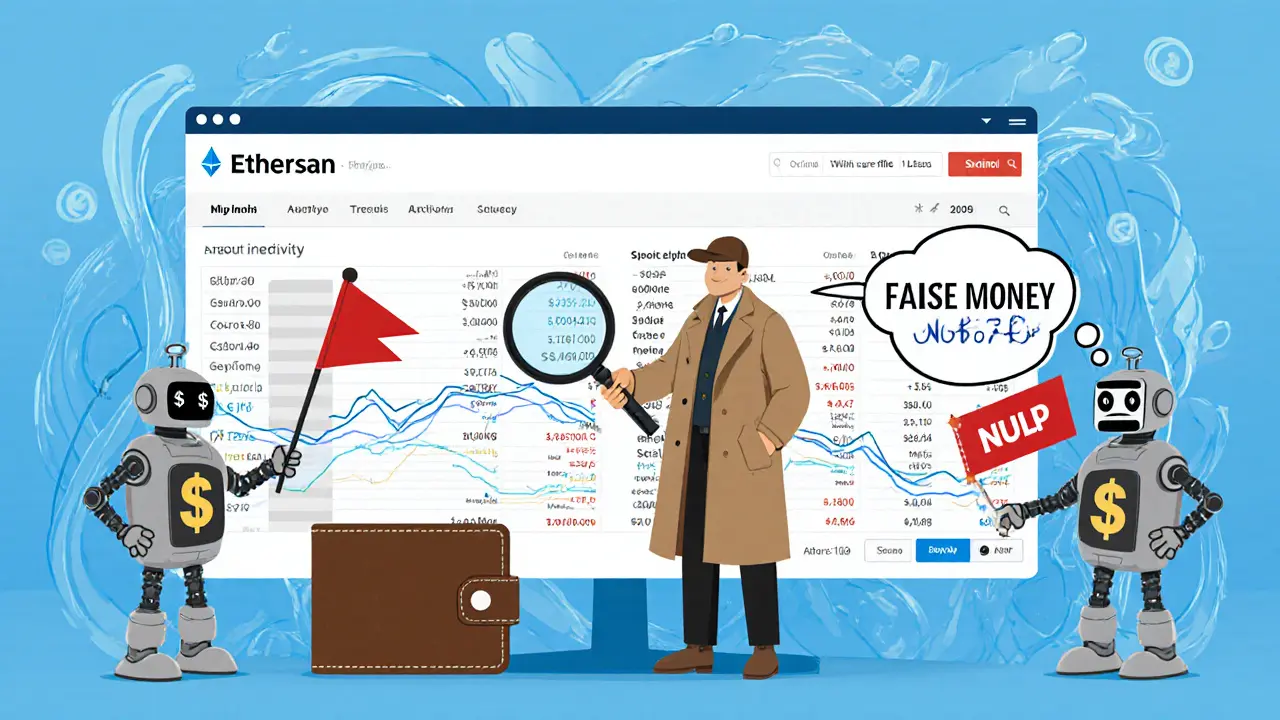
- Exchange internal transfers: When someone sends BTC from Coinbase to another Coinbase user, it never hits the blockchain. But many “whale alert” systems count it as on-chain activity. That’s why 62% of alerts in 2023 were false positives.
- Token minting: In August 2023, Tether minted $1B in USDT. On-chain activity exploded. But it didn’t move the market. The money stayed on the issuer’s balance. Without context, you’d think demand surged.
That’s why experts warn against “on-chain fundamentalism”-the idea that more transactions equal more value. As Dr. David Gerard put it, “You can’t measure economic activity by counting clicks.”

How to Get Started
If you’re new, here’s how to begin:- Learn the basics: Understand UTXO vs. account models, how blocks are confirmed, and what gas fees are. Spend 20 hours on free resources like CoinMarketCap Academy.
- Use free explorers: Go to Etherscan or Blockchain.com. Look up a wallet. See how many transactions it’s made. Track a token’s flow over a week.
- Follow one metric: Start with NUPL or SOPR. Watch how it moves over time. Don’t trade on it yet-just observe.
- Compare with price: Overlay your metric with the asset’s price chart. Look for correlations. Did NUPL drop before a price rebound? That’s your signal.
Most beginners try to jump into complex dashboards and get overwhelmed. Start simple. You don’t need Python or SQL right away. Just learn to read the numbers.
The Future: AI, Privacy, and Regulation
The field is changing fast. In 2023, 78% of analytics platforms started using machine learning to filter out bot activity and reduce false alerts. Nansen’s Smart Alerts cut false positives by 37%. Glassnode now tracks holding periods across years, not just days.But privacy is rising. Zero-knowledge proofs and confidential transactions are becoming standard in new blockchains. That means less data will be visible in the future. Some experts believe on-chain analysis will shift from tracking transactions to modeling economic behavior-like how much value is being created, not just how many transfers happen.
Regulators are catching up too. The SEC accepts on-chain analysis for AML compliance. The EU’s MiCA law requires stablecoin issuers to monitor on-chain activity. That means more institutions will need these tools-not just traders.
Companies like Bloomberg now integrate Glassnode data into their terminals. That’s a sign: this isn’t a crypto niche anymore. It’s becoming part of mainstream finance.
Final Thought: Data Doesn’t Predict-It Reveals
On-chain data mining won’t tell you the next crypto to 10x. But it will show you who’s buying, who’s selling, and whether the network is alive or just spinning its wheels. It turns speculation into observation. And in a market full of noise, that’s priceless.The most successful analysts don’t chase signals. They ask: What’s the story behind the numbers? And they wait for the data to speak.
Is on-chain data really public and permanent?
Yes. Every transaction on public blockchains like Bitcoin and Ethereum is permanently recorded and viewable by anyone. Once confirmed, it cannot be altered or deleted. This immutability is what makes on-chain data trustworthy for audits, compliance, and market analysis.
Can I track who owns a wallet address?
You can see the transaction history of any address, but not necessarily who owns it-unless the wallet is labeled. Platforms like Nansen identify wallets linked to exchanges, DeFi protocols, or known entities. Private wallets remain anonymous unless the owner reveals their identity through public activity, like signing a message or linking to a known service.
Are on-chain metrics reliable for trading?
They’re useful, but not foolproof. Metrics like NUPL and SOPR have historically signaled market turning points with high accuracy. However, they don’t predict future price movements on their own. They work best when combined with price action, volume, and market sentiment. Many traders use them as confirmation tools, not entry signals.
Why do some on-chain alerts turn out to be false?
Most false alerts come from exchange internal transfers. When someone sends BTC from Coinbase to another Coinbase user, the transaction never hits the blockchain. But some alert systems count it as on-chain activity. Also, bots and automated trading can create spikes in volume that look like real demand. Advanced platforms now use machine learning to filter these out, but free tools often can’t.
Do I need coding skills to do on-chain analysis?
Not to start. You can explore data using free block explorers without writing a single line of code. But to go deeper-like building custom dashboards, automating alerts, or analyzing token flows-you’ll need SQL or Python. Most professionals learn these skills after understanding the basics. Tools like Nansen and Glassnode abstract away the coding, so you can focus on interpretation.
Can I use on-chain data for non-crypto applications?
Absolutely. Companies like Walmart use blockchain to track supply chains, and on-chain data helps verify shipment records in real time. Banks use it for AML compliance. Even governments are exploring it for land registries and voting systems. The same principles apply: transparent, tamper-proof records create trust without middlemen.
What’s the biggest mistake beginners make?
They treat on-chain data like a crystal ball. Seeing a whale buy ETH doesn’t mean the price will go up. They ignore context-like whether the wallet is an exchange, a protocol, or a long-term holder. The best analysts don’t chase spikes. They ask: Why is this happening? And what’s the real story behind the numbers?