
When you hear about sanctioned entity crypto transactions reaching $15.8 billion in 2024, it sounds like a headline meant to scare investors or signal a total breakdown of financial controls. But the reality is far more complex than a simple panic button. That figure represents a specific slice of the digital asset world-money moving into wallets linked to countries and groups under strict international restrictions. It doesn’t mean $15.8 billion vanished into thin air, nor does it imply that every transaction involving Bitcoin or Ethereum is tainted. Instead, it highlights a growing, sophisticated arms race between those trying to bypass global economic pressure and the agencies working to stop them.
In 2024, this volume accounted for roughly 39% of all illicit cryptocurrency activity. To put that in perspective, while fraud and scams still make up a huge chunk of bad actor behavior, sanctions evasion has become the single largest driver of illegal crypto flows. This shift tells us something important: as traditional banking channels close off for certain regimes, digital assets aren't just an alternative-they’re becoming the primary lifeline for sanctioned economies.
The Numbers Game: Why Estimates Vary So Wildly
If you look at reports from different blockchain analytics firms, you’ll notice a glaring discrepancy. Chainalysis reported that $15.8 billion flowed to sanctioned jurisdictions and entities. TRM Labs put the number slightly lower at $14.8 billion, noting a drop from $21.9 billion in 2023. Meanwhile, CoinLaw.io claimed only $2.7 billion was directly linked to OFAC-sanctioned entities. How can three reputable sources disagree by such wide margins?
The answer lies in methodology. Defining what constitutes a "sanctioned transaction" is incredibly difficult. Are we counting money sent to a wallet once flagged by the U.S. Treasury’s Office of Foreign Assets Control (OFAC)? Or are we including funds moved through mixers before hitting a known address? Some firms track direct inflows to designated addresses, while others use heuristic models to estimate indirect exposure. For instance, if a user sends money to a clean wallet, which then interacts with a sanctioned mixer, does that count? The lack of a universal standard means these numbers should be viewed as estimates rather than exact ledgers. However, despite the variance, all major analysts agreed on one thing: sanctions-related activity remained the dominant force in illicit crypto volume during 2024.
| Firm | Sanctioned Entity Inflows | Total Illicit Volume | Key Insight |
|---|---|---|---|
| Chainalysis | $15.8 billion | $40.9 billion | Focuses on jurisdictional trends and broad illicit categories. |
| TRM Labs | $14.8 billion | $45 billion | Reports a 24% decrease in total illicit volume since 2023. |
| CoinLaw.io | $2.7 billion | N/A | Strictly tracks direct links to OFAC-designated addresses. |
How Money Moves: The Technical Anatomy of Evasion
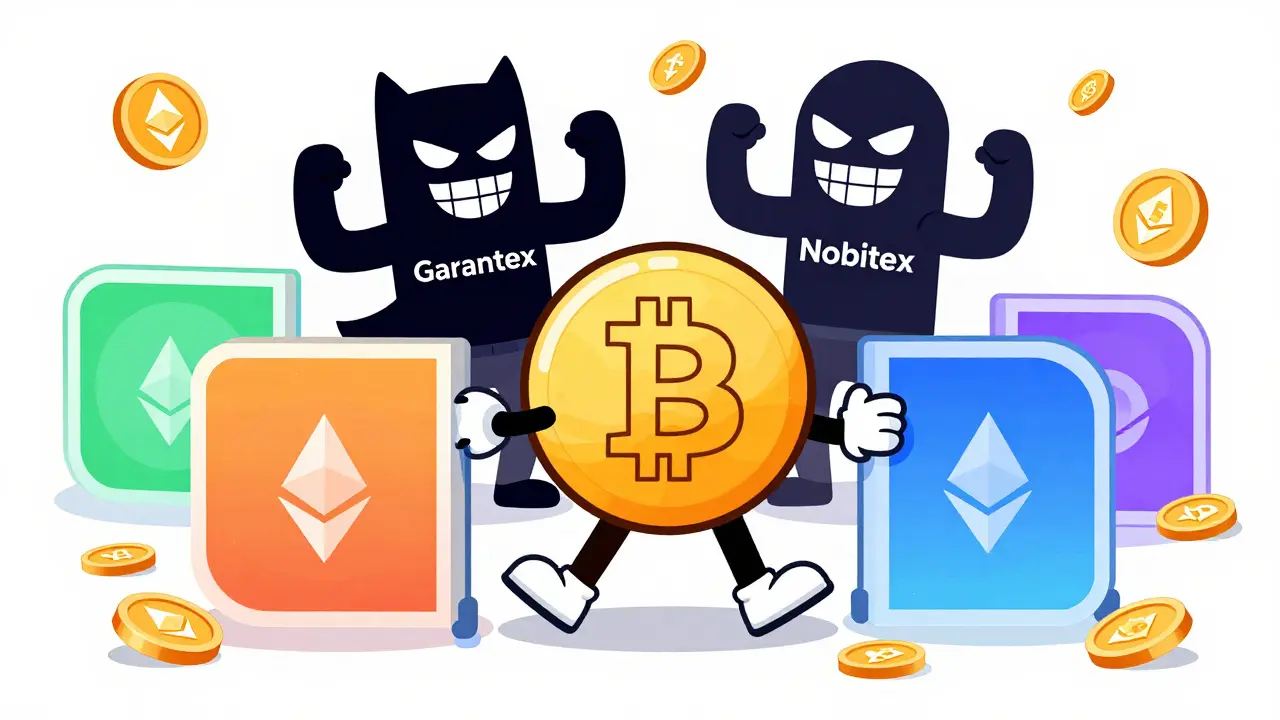
You might assume that moving billions in crypto requires high-tech quantum computers or secret underground labs. In reality, the infrastructure is surprisingly concentrated. In 2024, two platforms-Garantex and Nobitex-accounted for over 85% of all inflows to sanctioned entities. Garantex, a now-sanctioned exchange, became a hub for converting ransomware proceeds into usable currency. Nobitex, an Iranian centralized exchange, saw massive surges in usage, signaling capital flight attempts within Iran.
The choice of cryptocurrency matters too. Bitcoin dominated, comprising 68% of all transactions tied to sanctioned parties. Its maturity and widespread acceptance make it the preferred vehicle for large transfers. Ethereum followed with 20%, largely due to its smart contract capabilities, while stablecoins like Tether (USDT) made up the remaining 12%. Stablecoins are crucial here because they offer price stability, allowing sanctioned actors to move value without worrying about market volatility eating away their profits.
Sophistication is also increasing. Cross-chain bridges were used in 19% of transactions to evade tracking. By moving assets from one blockchain to another (e.g., from Ethereum to Binance Smart Chain), actors can break the direct link between sender and receiver, forcing analysts to stitch together fragmented data trails. Additionally, 55% of OFAC-designated wallets processed individual transactions exceeding $500,000. This indicates that small-scale retail users aren't driving this trend; organized criminal enterprises and state-backed actors are.
The Rise of DeFi in Sanctions Evasion
Perhaps the most significant development in 2024 was the role of Decentralized Finance (DeFi). Traditionally, regulators could sanction exchanges by freezing their accounts or pressuring them to comply with KYC (Know Your Customer) rules. DeFi protocols, however, have no central authority to sanction. They operate via code.
In 2024, 33% of illicit crypto funds were funneled through DeFi platforms linked to sanctioned entities. This creates a massive enforcement challenge. How do you sanction a liquidity pool? OFAC responded by flagging 150 specific DeFi liquidity pools that facilitated transactions with sanctioned entities. This approach forces decentralized autonomous organizations (DAOs) and protocol developers to decide whether to block access from certain IP addresses or risk secondary sanctions. It’s a gray area that legal experts are still debating, but it signals a clear intent: regulators will try to impose traditional compliance frameworks on non-traditional systems.
Regional Hotspots: Iran and Russia Lead the Way
Not all sanctioned regions behave the same way. Iran’s growing reliance on cryptocurrency drove much of the jurisdictional shift in 2024. With its banking system heavily isolated, Iranian centralized exchanges became critical nodes for moving capital out of the country. Transaction patterns suggest significant capital flight, as citizens and businesses seek to preserve wealth against inflation and political instability.
Russia-linked activity remained substantial, particularly in the realm of cybercrime. In 2024, $800 million worth of ransomware payments were routed through sanctioned wallets, a 22% increase from the previous year. Darknet marketplaces facilitated $1.1 billion in crypto transactions tied to sanctioned parties, with Russia-based markets leading the charge. The connection between ransomware gangs like Conti, Black Basta, and LockBit, and sanctioned exchanges like Garantex, shows a tightly integrated ecosystem where cybercriminals provide the funds, and sanctioned infrastructure provides the exit ramps.
Enforcement Capabilities: Strengths and Limitations
Regulators aren’t sitting idle. The U.S. Treasury’s OFAC issued 13 designations that included specific cryptocurrency addresses in 2024. While slightly fewer than in 2023, this remains near the highest level in seven years. More importantly, the strategy has shifted. Rather than just targeting individuals, agencies are dismantling entire financial infrastructures. Sanctioning Garantex wasn’t just about punishing one company; it was about cutting off a key service provider for dozens of ransomware groups.
Blockchain analytics tools have improved dramatically. AI-driven enforcement allows firms to identify patterns associated with sanctioned entities across multiple networks simultaneously. However, the sheer scale of the problem is daunting. Total crypto transaction volume grew to over $10.6 trillion in 2024, up 56% since 2023. Monitoring every transaction is impossible. Analysts note that annual estimates of illicit activity often grow by 25% between reporting periods simply because new illicit addresses are identified and retroactively categorized. This means today’s $15.8 billion figure could rise significantly as better detection methods are applied to historical data.
What Comes Next? The Future of Sanctions Compliance
Looking ahead, the battle lines are being drawn. As cryptocurrency adoption grows globally, sanctioned entities will continue to leverage digital assets for cross-border transactions. We can expect more sophisticated privacy coins, improved cross-chain bridges, and evolving DeFi protocols designed specifically to resist surveillance. On the other side, regulatory responses will likely include enhanced international cooperation, shared intelligence databases, and potentially new legal frameworks tailored explicitly for digital asset sanctions compliance.
For businesses operating in the crypto space, this means stricter due diligence is no longer optional-it’s existential. Ignorance of your counterparty’s status is not a defense. The convergence of geopolitical tension and technological innovation ensures that the next few years will be defined by this high-stakes race between evasion and enforcement.
Why do different firms report different amounts for sanctioned crypto transactions?
The discrepancies arise from differing methodologies in defining "sanctioned." Some firms count only direct transactions to OFAC-listed addresses, while others use heuristic models to estimate indirect exposure through mixers, bridges, or associated clusters. There is no universal industry standard for calculation, leading to varying totals.
Is Bitcoin the main cryptocurrency used by sanctioned entities?
Yes, in 2024, Bitcoin comprised 68% of all transactions tied to sanctioned parties. Its dominance is due to its widespread acceptance, liquidity, and established infrastructure for large-value transfers, making it the preferred asset for moving significant sums across borders.
How did DeFi platforms contribute to sanctions evasion in 2024?
DeFi platforms handled 33% of illicit funds linked to sanctioned entities. Because DeFi protocols lack centralized control, they are harder to shut down. Regulators responded by flagging specific liquidity pools, forcing decentralized services to navigate complex compliance requirements regarding access restrictions.
Which countries showed the highest increase in sanctioned crypto activity?
Iran and Russia were the primary drivers. Iran saw a surge in centralized exchange usage linked to capital flight, while Russia-linked activity increased significantly in ransomware payments and darknet marketplace transactions, with $800 million in ransomware funds routed through sanctioned wallets.
What is the role of cross-chain bridges in evading sanctions?
Cross-chain bridges were used in 19% of transactions to evade tracking. By moving assets between different blockchains, actors can obscure the trail of funds, making it more difficult for blockchain analytics firms to connect the original sender to the final recipient.