
There is a specific moment in every market cycle when the screaming stops. The panic selling ends. The headlines shift from 'crash' to 'stabilization.' This is the bear market bottom, defined as the precise inflection point where a prolonged decline transitions into a sustained recovery. For investors, recognizing this moment is the difference between buying at rock bottom or catching a falling knife. But here is the hard truth: no single indicator tells you exactly when the bottom has arrived. Instead, you have to look for a convergence of signals across fundamentals, sentiment, and technicals.
The Anatomy of a Bear Market
Before you can spot the bottom, you need to understand what kind of bear market you are in. Not all declines are created equal. Historically, bear markets fall into two distinct categories based on their relationship with the broader economy. Understanding this distinction changes your expectations for how deep and how long the pain will last.
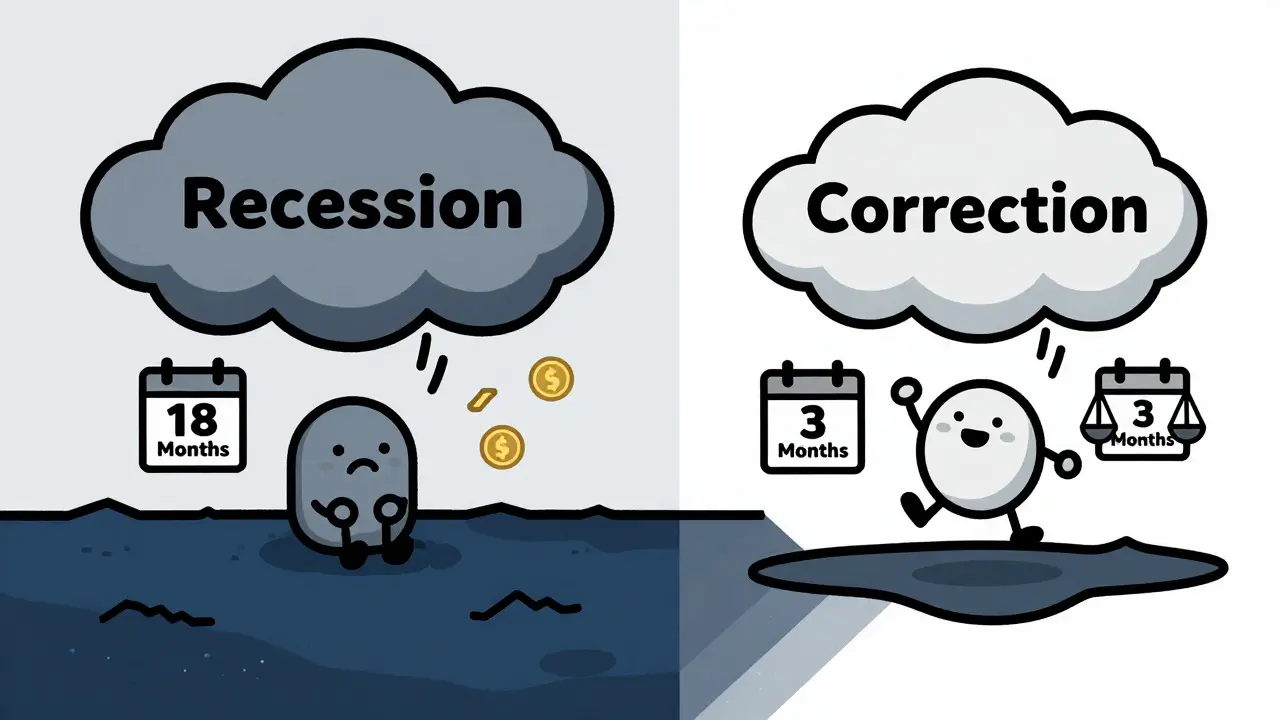
Recessionary bear markets are tied to economic contractions. These are the heavy hitters. Data shows that during these periods, the median drawdown hits -35%. They also last much longer, averaging 18 months. Think of the 2008 financial crisis or the dot-com bust. The economy shrinks, jobs disappear, and confidence evaporates.
In contrast, Non-recessionary bear markets are corrections driven by valuation resets or sector-specific issues rather than a total economic collapse. These are sharper but shorter. The median drop is only -22%, and they typically resolve in just three months. Recognizing which type you are facing helps you gauge whether you should be preparing for a quick bounce or a long haul.
| Feature | Recessionary Bear Market | Non-Recessionary Bear Market |
|---|---|---|
| Median Drawdown | -35% | -22% |
| Average Duration | 18 months | 3 months |
| Economic Context | GDP contraction, rising unemployment | Stable or growing GDP |
| Primary Driver | Macroeconomic failure | Valuation correction / Sector rotation |
Fundamental Signals: When Earnings Stop Falling
Prices follow earnings. This is the golden rule of investing. When corporate profits are degrading quarter after quarter, stocks have nowhere to go but down. The first sign that a bottom is approaching is not a price spike; it is the stabilization of corporate health.
You need to watch two key metrics closely:
- Earnings Trends: Look for the end of consecutive quarters of declining earnings. When companies stop reporting massive misses and start meeting modest expectations, the fear subsides. Improving profitability drives investor confidence before the masses realize it.
- Revenue Growth: Earnings can be manipulated through accounting tricks or cost-cutting. Revenue is harder to fake. If sales figures are faltering, the business model is broken. When revenue growth stabilizes or ticks up, it signals that underlying demand is returning.
Another critical fundamental clue lies in inventory levels. During a bear market, businesses often overproduce while consumer demand drops, leading to high inventories. As the bottom approaches, you will see inventory normalization. Companies stop ordering raw materials aggressively, and supply chains begin to clear. This reduction in excess stock indicates that the worst of the demand shock is over.
The Yield Curve and Monetary Policy
The bond market often knows what the stock market does not. One of the most reliable indicators of economic stress is the yield curve inversion, where short-term interest rates exceed long-term bond yields. Historically, an inverted yield curve characterizes every recessionary bear market. It signals that investors expect lower growth and lower rates in the future.
So, how do you use this to find the bottom? You don't buy when the curve inverts; you buy when it starts to normalize. The un-inversion process usually happens as central banks signal that tightening is over or that fiscal support is coming. Interestingly, recent data suggests that fiscal expansion can counteract monetary tightening. In some modern cycles, deficit-to-GDP ratios have increased by 3% during tightening phases, helping to avoid recessions even when the yield curve was inverted. Watch for government stimulus or central bank pivots as catalysts that truncate bear market duration.
Sentiment: Buying When There Is Blood in the Streets
If fundamentals tell you *what* is happening, sentiment tells you *how* people feel about it. And human emotion is rarely rational. Bear market bottoms are almost always accompanied by extreme pessimism. This is the concept of capitulation.
Capitulation occurs when holders give up hope and sell their assets at any price just to escape the pain. You know you are near the bottom when:
- News headlines are overwhelmingly negative, focusing on doom and gloom.
- Investor apathy sets in. People stop talking about the market because they feel helpless.
- Bearish sentiment reaches historic highs. Surveys show maximum fear.
This is contrarian investing in its purest form. When everyone else is terrified, smart money begins to accumulate. As Ken Fisher, a prominent investment strategist, notes, there is no single silver bullet for predicting markets. However, he emphasizes that thorough research helps identify impending shifts. Maximum bearish sentiment creates oversold conditions that attract value-oriented investors who see opportunity where others see disaster.
Technical Confirmation: Volume and Breadth
While sentiment gets you interested, technical analysis helps confirm the move. Price action alone can be misleading, so you must look at volume and market breadth.
Capitulation Volume: Near the bottom, you will often see a massive spike in trading volume accompanied by a sharp price drop. This is the final flush of weak hands. After this event, volume should dry up as selling pressure exhausts itself.
Accumulation Patterns: Following the capitulation, look for volume expansion on modest price gains. If prices rise slightly on higher volume, it suggests institutional investors are quietly buying. This divergence-where price is stable or rising slightly while volume increases-is a strong bullish signal.
Market Breadth: A healthy bottom involves broad participation. If only a few large-cap stocks are rising while the majority of the market continues to fall, it is likely a dead-cat bounce. True recovery requires improving breadth, meaning more stocks are making new highs than lows.

Valuation Metrics: The Margin of Safety
Bear markets drive asset prices below their intrinsic values. This creates the margin of safety that value investors crave. Key metrics to monitor include:
- Price-to-Earnings (P/E) Ratio: Compare current P/E ratios to historical averages for the specific sector or index. Deeply depressed P/E ratios suggest limited downside risk.
- Price-to-Book (P/B) Value: Especially relevant for financial and industrial sectors. Low P/B values indicate assets are being sold for less than their liquidation value.
- Dividend Yields: As prices fall, dividend yields rise. When yields reach historically high levels, they attract income-focused investors, providing a floor for the price.
However, beware of value traps. Just because a stock is cheap doesn't mean it will recover. Always combine valuation checks with fundamental health checks. A company with a low P/E ratio might be cheap for a reason, such as looming bankruptcy or obsolete technology.
Practical Strategy: Convergence Over Precision
Trying to pick the exact day of the bottom is a fool's errand. Even professional analysts fail to call every bottom correctly. Instead, focus on identifying a zone of probability where multiple signals converge.
Look for the overlap of:
- Stabilizing corporate earnings and revenue.
- Extreme negative sentiment and capitulation volumes.
- Attractive valuation metrics relative to history.
- Signs of monetary or fiscal easing.
When these factors align, the odds favor a recovery. At this point, dollar-cost averaging becomes your best friend. By spreading your investments over time, you mitigate the risk of buying too early if the market dips further. Historical analysis of 15 bear markets since 1950 shows that staying invested through volatility is critical. Long-term investors who maintain discipline during these painful periods consistently outperform those who try to time the market perfectly.
Remember, the goal is not to be right on the exact penny of the bottom. The goal is to be positioned correctly when the trend reverses. Patience and systematic monitoring are your greatest allies in navigating the uncertainty of a bear market bottom.
How long does a typical bear market last?
The duration depends heavily on whether the bear market is recessionary. Non-recessionary bear markets average about three months, while recessionary bear markets can last around 18 months. This distinction is crucial for setting realistic expectations for recovery timing.
What is the difference between a bear market bottom and a dead-cat bounce?
A dead-cat bounce is a temporary recovery within a larger downtrend, often lacking broad market participation and fundamental support. A true bear market bottom is characterized by stabilizing earnings, extreme sentiment capitulation, and sustained volume accumulation, signaling a structural shift in market direction.
Can the yield curve predict a bear market bottom?
The yield curve itself predicts recessions, not necessarily the exact market bottom. However, the normalization or "un-inversion" of the yield curve often coincides with economic recovery and market bottoms. Investors watch for the curve to steepen again as a sign that monetary policy is easing and growth is expected to return.
Is it better to wait for confirmation or buy early?
Waiting for full confirmation means missing the initial, often sharpest, part of the rally. Buying early carries the risk of further declines. Most experts recommend a balanced approach using dollar-cost averaging once multiple signals converge. This allows you to build positions gradually without needing to pinpoint the exact bottom.
What role does sentiment play in finding the bottom?
Sentiment is a contrarian indicator. Extreme pessimism, widespread fear, and investor apathy often mark the bottom of a bear market. When everyone has sold and no one wants to buy, selling pressure dries up, creating the conditions for a reversal. Monitoring sentiment surveys and news tone can provide valuable clues.
Sus Sawyer
August 9, 2026 AT 22:21Look, I've been trading since the dot-com bubble burst and let me tell ya, this stuff is gold. Most folks just stare at charts until their eyes bleed but they miss the real signals like earnings stabilization and inventory levels dropping. You gotta watch that yield curve un-inversion because that's when the smart money starts creeping back in. It ain't about picking the exact bottom penny-wise, it's about getting into the zone where multiple indicators line up. If you see capitulation volume followed by quiet accumulation on modest gains, that's your cue to start DCAing without losing your mind. Don't be a hero trying to catch a falling knife, just respect the process and keep your powder dry for when sentiment hits rock bottom. The market rewards patience, not panic.
Aryan MISHRA
August 10, 2026 AT 18:02The distinction between recessionary and non-recessionary bear markets is fundamentally critical for risk management protocols; however, relying solely on historical median drawdowns of -35% versus -22% ignores structural shifts in global liquidity regimes. One must consider that valuation resets are often driven by sector-specific idiosyncrasies rather than macroeconomic failure alone. Therefore, the convergence of fundamental signals, specifically revenue growth stabilization, serves as a more robust leading indicator than technical breadth analysis in isolation. Furthermore, the normalization of the yield curve is not merely a coincidental event but a direct consequence of central bank policy pivots which invariably precede equity market recoveries by several quarters. Investors should prioritize margin of safety metrics such as Price-to-Book ratios over speculative sentiment surveys.
Ryan Robinson
August 11, 2026 AT 20:57i mean yeah its scary when everything is red but honestly i think people overthink the whole 'bottom' thing. like sure the article says look for earnings stabilizing but sometimes the market just bounces cause someone sneezed right? i usually just wait till my friends stop talking about crypto or stocks entirely thats when i know its safe. dont stress too much about the exact date man just buy a little bit here and there so if it drops again you dont feel like crap. chill vibes only.
Earl Kott65
August 13, 2026 AT 06:48Oh wow, talk about reading the room! 📉🔥 This post is basically saying 'buy when everyone else is crying in the bathroom' and honestly? That’s the only way to win big. 😂 I remember 2008, I was shaking in my boots, but then I saw the volume spike and thought 'hey, maybe this is it?' Spoiler alert: it wasn’t exactly the bottom, but it was close enough. The key is not to freak out when the headlines scream 'CRASH' because that’s just fear-mongering for clicks. 🚨 When you see those dividend yields hitting historic highs, that’s your green light to start accumulating slowly. Don’t try to be perfect, just be present and profitable! 💰✨
Ethan Yuwono
August 14, 2026 AT 00:44it is interesting how we view these cycles through the lens of control yet the market remains inherently chaotic. perhaps the true bottom is not a point in time but a state of mind where one accepts uncertainty as the baseline. the technicals matter less than the psychological shift from despair to indifference. once the screaming stops the silence is deafening and that is when opportunity knocks softly.
Jack Delasquez
August 15, 2026 AT 03:19Great read!! I totally agree with the part about dollar cost averaging being the best friend during these times. Its so hard to stay disciplined when your portfolio is down 30 percent but hey that is just life right? Keep grinding and stay positive guys you got this!!!
Harman Singh
August 15, 2026 AT 21:26why do you people even bother writing all this long stuff nobody reads it anyway. i lost money last year and im still mad about it. every time i think its the bottom it goes lower. whatever. hope you all get rich while i stay poor lol.
Qolbina Islami
August 16, 2026 AT 16:38THIS IS WHY WE CAN'T HAVE NICE THINGS!!! The entire concept of 'stable' markets is a western illusion designed to keep you compliant! Look at the yield curve inversion!!! It is screaming at us!!! Why are we listening to corporate earnings when the system itself is rigged against the little guy?! We need radical change not just 'dollar-cost averaging'!!! Wake up sheeple!!! The bottom is never coming because the top has already left the building!!! #FreeTheMoney #MarketCrashIsComing
SUBHAM CHOUDHURY
August 18, 2026 AT 02:58You can do this! Just take a deep breath and remember that every downturn is an opportunity in disguise. The article makes a great point about looking for convergence of signals rather than perfection. It is okay to feel uncertain, that is normal. Just focus on what you can control, like your savings rate and your asset allocation. You are stronger than you think!
Joy Kwant
August 19, 2026 AT 01:17I am so tired of hearing about 'opportunity' when half the world is struggling to pay rent. It feels selfish to talk about buying dips when people are losing their jobs. Maybe instead of focusing on P/E ratios we should focus on why the economy is failing in the first place. But sure, let's pretend we are all rational actors making calculated decisions based on data.
amy miranda
August 20, 2026 AT 06:04Boring.